Market Overview
Have a look ...World Tube & Pipe Market: Factors influencing the current situation
Dr. Gunther Voswinckel – Update as per December 2025
Welcome to ITA’s and VOSCO´s regular presentation of the main worldwide economic factors influencing the tube and pipe industry.
The US government intends to continue expanding oil and gas production, sustaining demand for OCTG tubes and pipelines in the US. OPEC+ has increased oil production this year. The Middle East conflict has eased, reducing fears of regional oil and gas shortages. Consequently, oil and gas prices have declined. Ongoing global demand for oil and gas, its transmission via pipelines, and demand for cars, machinery, and construction - especially in regions with high GDP growth - will support demand for tubular products.
New market segments such as CCUS (carbon capture and storage) and hydrogen pipelines will generate additional demand for tubular products, requiring larger quantities of higher-alloyed and stainless-steel tubes. The shift toward customer-centred production will continue to influence the landscape for tube manufacturers. Raw material prices for steel and pipe markets appear to have stabilized, but markets remain nervous with potential for volatility.
A potential risk arises if climate-change policies are not implemented with balance, potentially shifting energy-intensive industries to regions with lower energy costs. Nevertheless, supply-demand balance in the pipe industry has largely been restored, resulting in calmer price volatility.
The shift to environmentally friendly pipe production with a low carbon footprint has gained importance. Pipe manufacturers are converting facilities from gas to electricity. Geopolitical and logistical risks, as well as current and future energy costs, are central considerations.
Regions such as the USA, India, Turkey, the Middle East, and China benefit from lower energy costs. Political interventions and regulations increasingly influence industry strategies. The dynamic nature of developments makes timely responses challenging. Some manufacturers are reducing involvement in high-cost regions like Europe due to high costs, while seeking political countermeasures to offset cost disadvantages.
All supply sources are under scrutiny; there is hope that international trade will not be adversely affected.
Disruptive times also create opportunities: beyond oil and gas, new markets such as electromobility, production-site productivity improvements, and enhanced customer service tied to environmentally friendly practices offer opportunities. Skilled personnel availability is increasingly challenging in some regions like the US. Technology providers are expanding portfolios to include green, robotic, and digital solutions.
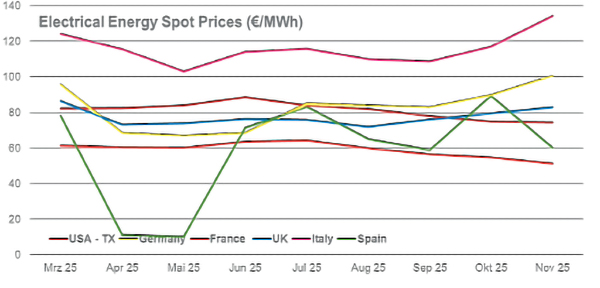
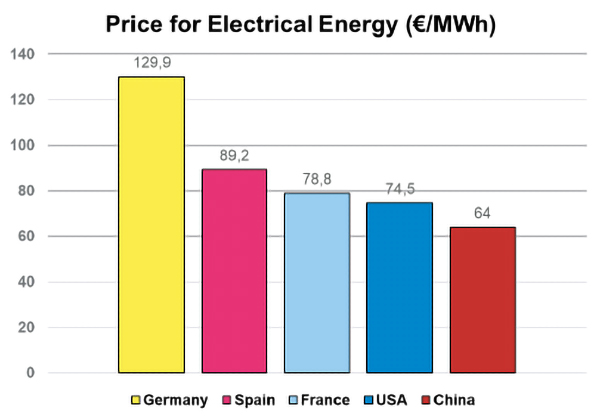
The availability of economical energy is decisive. Energy costs are monitored in selected regions worldwide (Figure 1). Geopolitical turbulences, regulations, and energy sources influence electricity costs. Prices remain volatile at roughly 15–135 €/MWh depending on country (Figure 1), reflecting the large increase over the last 20 years and consequent economic uncertainties for energy-intensive industries. November 2025 values (Figure 2) illustrate the challenges for energy intensive industry.
Europe exhibits wide price variation and rising costs. Sweden, France, and Spain are relatively better positioned than Italy and Germany. Countries with substantial nuclear or other low-cost base-load energy sources retain cost advantages. For example, US Texas electricity costs at about 75 €/MWh are ~30% lower than many European levels; tariffs further enhance competitiveness for tubular investments. The new US administration has signaled actions to further reduce energy costs.
Countries such as Saudi Arabia offer electricity at around 40 €/MWh or less. Unfavorable European regulations or grid costs could worsen the gap, driving relocation of production to lower-energy-cost regions. The energy-intensive industry’s concentration at the start of the production chain risks downstream impacts in regions with high electricity costs.
Natural gas dynamics
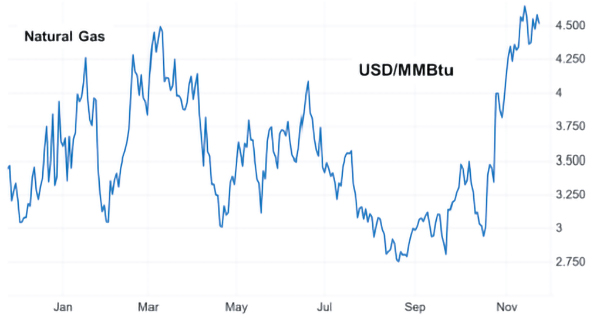
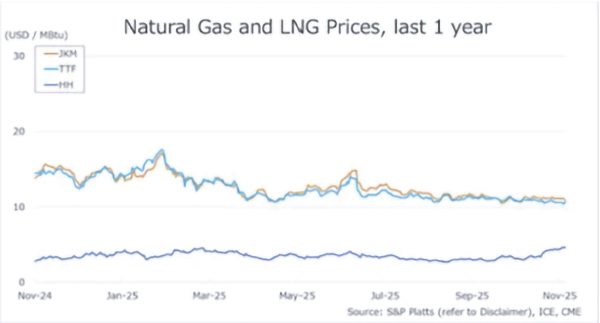
Natural gas remains a key energy source influencing the steel-tube market. Gas exploration and transport underpin tubular demand. Despite CO2-reduction efforts, gas remains important for many applications. Gas prices declined to around 2.75 USD/MMBtu in 2025, then strengthened to about 4.50 USD/MMBtu (Figure 3). Geopolitical conflicts and US market expectations contribute to volatility.
Producers and reserves
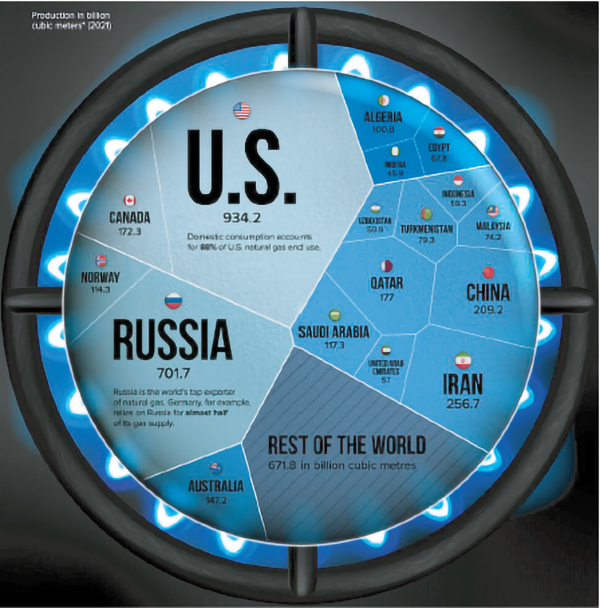
The US, at ~934 bcm today, is the largest gas producer and a gas superpower with growth potential (Figure 4). Domestic consumption is about 88% of production; 12% is exported as LNG.
Russia (~702 bcm) is the second-largest gas producer and the largest pipeline exporter, but sanctions and disrupted flows have created a structural disadvantage.
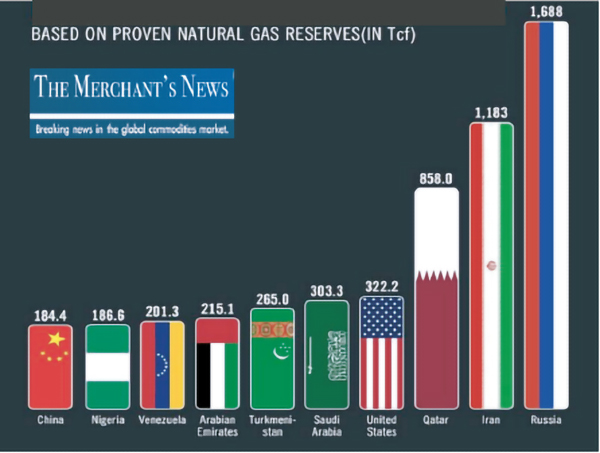
It must be realized that Russia has the largest reservoir of proven gas reserves with about 1.688 Tcf (Trillion Feet³) compared to only 322.2 Tcf in the US (Figure 5). Iran and Qatar hold also large reserves; Qatar is expanding LNG capacity; Iran’s reserves are constrained by sanctions and infrastructure.
Key takeaways
- US LNG terminals dominate Atlantic Basin flows.
- Qatar continues to anchor long-term supply agreements in Asia.
- Russia has largely lost its influence as Europe restructures its gas imports.
- Asia, including China, is becoming a structurally long-term LNG buyer.
- Middle Eastern exporters are rising as flexible swing suppliers.
The remaining global surplus has created the fastest-growing export engine in the energy sector. Future gas security will be shaped primarily by two poles: the United States, offering flexibility, and Qatar, providing reliability.
LNG dependency and Europe
Regions such as Europe, which lack adequate connections to international natural gas pipeline networks, are now heavily dependent on LNG. These regions face significantly higher prices for LNG compared with pipeline gas. LNG consumers encounter cost levels of roughly 11–13 USD/MMBtu, which is approximately 300% higher than typical pipeline-supplied natural gas (Figure 6).
These additional costs affect regions that cannot access affordable pipeline gas, making LNG a predominantly short-term solution to secure supply. The recently concluded agreement between the U.S. and Europe foresees energy deliveries worth about USD 750 billion over three years. In 2024, Europe imported roughly USD 80 billion in energy products from the U.S., including 36 million tons of LNG and a record 74.5 million tons of crude oil. Tripling such flows will be challenging, given recent growth rates. Although this agreement strengthens Europe’s supply security, it comes at elevated LNG prices. In the long term, Europe should consider alternative energy sources, including renewed evaluation of cost-effective pipeline options.
Political institutions in Europe have so far rejected additional pipeline projects, and the damaged Nord Stream 1 and 2 lines remain inactive. Alternative projects are under expert review, but political reluctance persists, despite potential cost advantages.
Hydrogen outlook
The long-term strategy to replace natural gas with green hydrogen is also increasingly questioned. Industrial-scale electrolysis requires substantial amounts of clean water and continuous electrical power – approximately 55 MW per ton of hydrogen – and the process is sensitive to fluctuations in electricity supply, which significantly reduces electrolyser stack lifetimes. As a result, economically viable green hydrogen production is limited to regions with stable and low-cost renewable or nuclear power. In most parts of Europe, such conditions are not yet achievable. Exceptions include Norway and Sweden. Hydrogen transport pipelines would create additional demand for alloyed steel tubes.
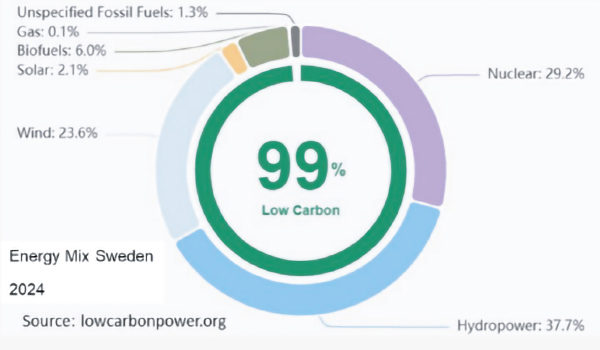
Sweden, with reliable hydro and nuclear baseload capacity, is uniquely positioned to produce green energy at competitive cost levels (Figure 7).
Some experts, including those from the OECD, advocate producing hydrogen in regions with abundant, low-cost electricity (e.g., the Middle East, North Africa, or parts of Central America). Energy-intensive intermediate products – such as DRI – could be manufactured near the energy source and then transported to industrial centers such as in Europe or Asia. This approach would preserve technological expertise and employment in downstream metallurgical processes. However, these concepts receive limited political support, with potential negative consequences for European metallurgical and tubular industries.
Global tube and pipe production
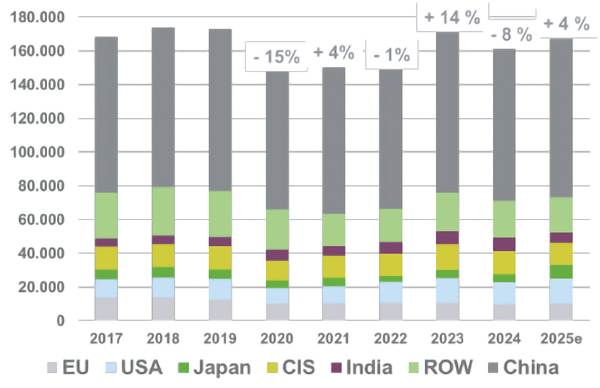
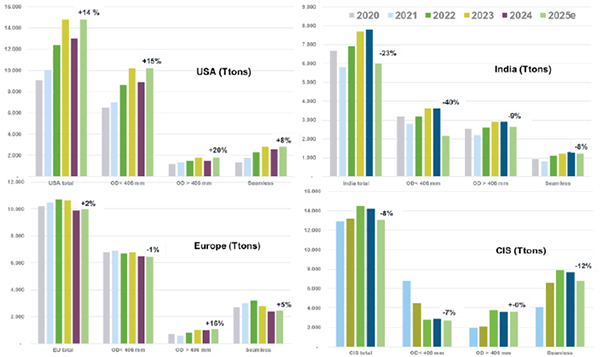
Global tube and pipe production in the first half of 2025 reached 83.6 million tons (full-year estimate: 167.2 million tons). After 161.2 million tons in 2024, this reflects a 3.7% recovery (Figure 8).
Regional trends
- United States: After a moderate 2024, 2025 production is expected to grow by 14%, driven by increased exploration. Tubes under 16” rose by 15%, and line pipes above 16” by 20%. Some producers are fully booked into 2026. It is anticipated that despite tariffs only further imports can scarify the US demand.
- India: After a record 2024, first-half 2025 production declined 23%, with welded tubes under 16” down 40%. Historically, India reports low first-half figures that recover later.
- Europe: Production remains at the low 2024 level, with only 2% growth in early 2025. Line pipes >16” increased 16%, and seamless production recovered 5% after earlier cuts.
- CIS: Total output declined 7% in 2024 and 8% in the first half of 2025. Seamless tubes were down by 12%.
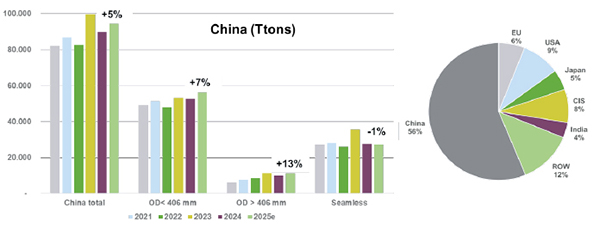
- China: Accounting for 56% of global output, China grew 5% in the first half of 2025 (Figure 10). Line pipes >16” rose 13% and tubes <16” by 7%, with strong activity in the Middle East compensating for U.S. trade restrictions.
Prices, raw materials, and margins
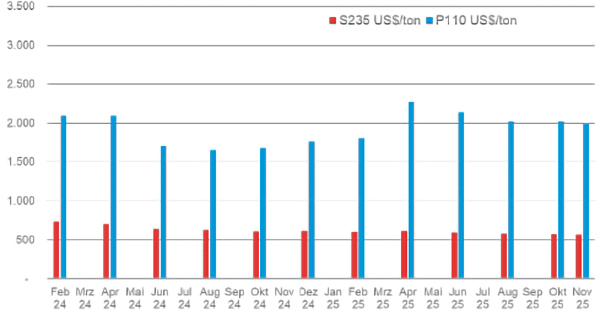
Prices for OCTG and structural tubes appear to have stabilised in 2025. Figure 11 shows price development for:
- P110 OCTG casing (5.5”)
- S235 structural pipe
After peaking at ~USD 3,900/ton in October 2022, P110 prices declined by ~58% to ~USD 1,650/ton by August 2024. They have since stabilized around USD 2,000/ton, with potential for renewed increases given strong US demand. S235 structural pipe prices remained comparably stable at ~USD 600/ton, supported by infrastructure projects.
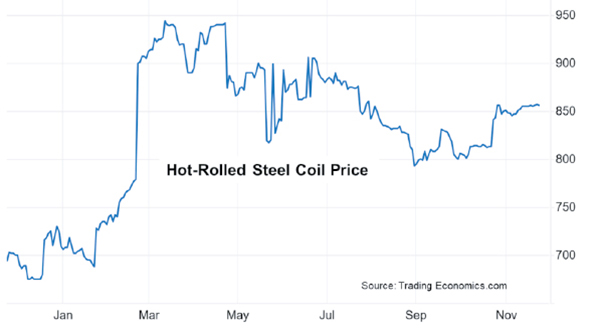
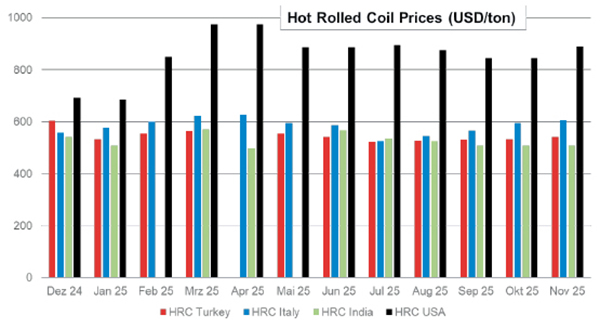
About 74% of global pipe production is welded (~123 million tons in 2025), making producers highly dependent on hot-rolled coil (HRC) prices. US HRC prices fell from about USD 940/ton in March 2025 to USD 800/ton in September, then recovered to around USD 850/ton (Figure 12). Further increases are likely.
In contrast, Turkey (~USD 540/ton) and India (~USD 510/ton) trade at significantly lower HRC levels (Figure 13). Narrow margins in welded tube production, including occasional negative margins, remain a structural challenge. Specialty grades for OCTG are increasingly expensive and difficult to source.
Demand drivers: oil & gas, pipelines, CCUS
The oil and gas sector accounts for roughly 51% of global tube and pipe demand. OCTG consumption correlates strongly with oil prices (Figure 14). OPEC+ struggled to maintain oil prices above USD 90/Bbl despite voluntary cuts of 2 million Bbl/day, extended into March 2025. The group has since reversed its strategy, gradually increasing output and deciding to fully revoke the 2.2 million Bbl/day cuts as of November 2025, citing global economic stabilization and potential concerns about rising US production.
US oil output rose from 12.0 million Bbl/day in August 2022 to 13.4 million Bbl/day in July 2025 (+11.2%). The US Energy Information Administration (EIA) now forecasts a record 13.61 million Bbl/day for 2025 and 13.53 million Bbl/day for 2026. US oil exports reached a record 5.5 million Bbl/day, equal to 41.6% of global crude production.
According to Oilprice.com, US rig count for oil declined from 480 in January to 412 in December 2025 (-14%), this despite enlarged output but caused by improved rig productivity. Number of gas rigs in the same period increased from 98 to 129, mainly driven by shale gas. US policy continues to prioritize fossil fuels and nuclear energy, with reduced focus on wind and solar.
At the same time, expected global oil demand for 2025 is rising by 100,000 to 20.6 million bpd, while the EIA expects stagnation for 2026. The EIA expects a global surplus of up to 4.09 million Bbl/day next year.
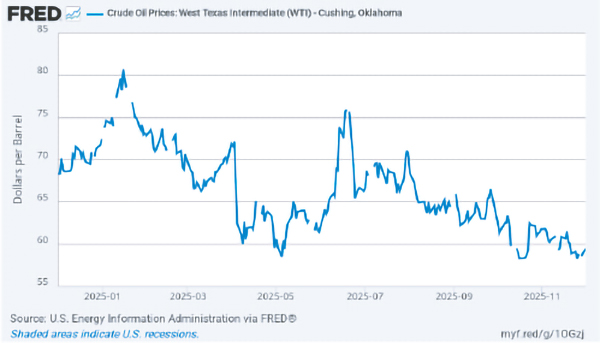
Prices are projected to remain low in 2025 at average USD 65.32/Bbl (WTI) and USD 68.91/Bbl (Brent). Demand for tubular products will remain strong as energy security concerns persist.
Corrosion and wear continue to challenge OCTG performance, particularly in H2S/CO2-rich environments. As a result, demand is rising for tubular products made from corrosion-resistant alloys (CRA) and clad materials, offering manufacturers opportunities for differentiation.
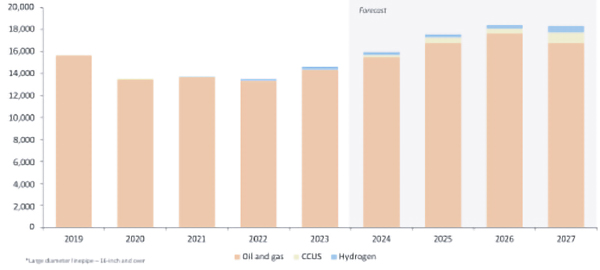
Despite delays in pipeline projects, demand remains high (Figure 15). The significant rise in line-pipe output in 2025 confirms this trend. Geopolitical and economic developments require substantial investments in oil and gas transport networks.
Carbon Capture, Utilisation and Storage (CCUS) represent an emerging market requiring extensive pipeline infrastructure. CO2 transport demands higher-alloyed materials due to corrosive conditions. Developing CO2 pipeline networks will be essential for large-scale deployment and cost reduction, although challenges remain in permitting, investment, and public acceptance. Adoption is increasing in the U.S., the Middle East, and beyond.
Other demand sectors
Automotive
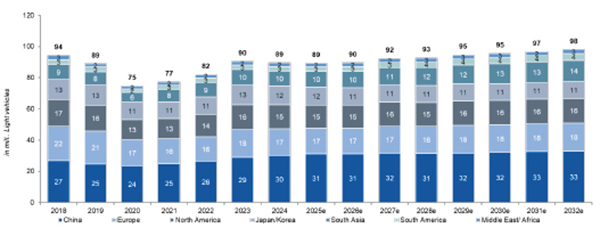
The automotive sector represents about 15% of global tube demand. According to IHS, global light-vehicle production declined to 89.5 million units in 2024 and is expected to fall slightly to 89.2 million in 2025 (Figure 16). A modest recovery is expected only by 2026. North America and Europe face production cuts of 2.4% and 2.6%, respectively, while South America and China are projected to grow by 3.4% and 0.1%. Higher US tariffs and supply chain disruptions raise manufacturing costs. Battery-Electric Vehicles (BEVs), however, are expected to grow by ~30% to 15.1 million units, creating new applications for tubular products in frames and body structures.
Mechanical engineering
Mechanical engineering accounts for roughly 9% of global tube output. Market volume is expected to grow from USD 3.3 trillion in 2024 to USD 3.7 trillion in 2030 (+12%), driven mainly by China, the US, and Europe (Figure 17).
Construction
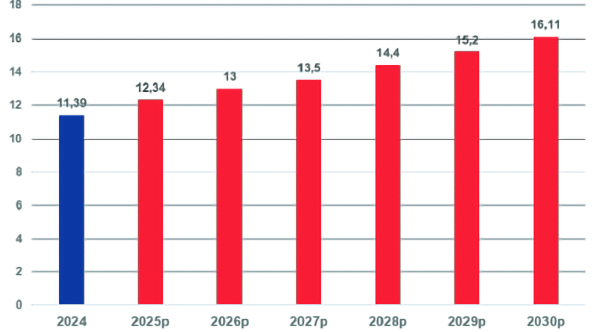
Construction represents about 5% of tube demand. According to NMSC (June 2025), the global construction market reached USD 11.4 trillion in 2024 and is expected to exceed USD 16.1 trillion by 2030 (+41%). Population growth and major infrastructure initiatives – especially in the Gulf states and emerging markets – are key drivers.
Adoption of structural tubes in construction varies globally. North America and parts of Asia widely use tubular structures, whereas Europe continues to rely mainly on concrete and open-section steel structures. The tube industry must promote the advantages of tubular profiles, including flexible geometry, high mechanical performance, smooth surfaces, and suitability for long spans. Alloyed steels may offer additional benefits.
From a sustainability perspective, tubes produced from scrap in EAFs using green power significantly reduce carbon footprint. Additional capacity is particularly needed in India to meet growing demand.