
Page 26 - ITAtube Journal 1 2019
P. 26
Technical Papers
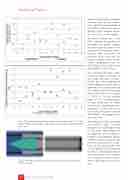
Fig. 5. The variation of wall thickness value for a) the pipe ø 200 x 31.8 mm (values obtained by simulation and rolling); b) the pipes, obtained by rolling at the mill
along the length of the workpiece has been shown to have a signif- icant impact on the magnitude of such defects, which is not seen as strongly in the computer simula- tions (see Fig. 5, b for example).
An optimal element size in the finite element discretization of the model and optimal integra- tion time step may improve the accuracy of the simulation results. However, mesh refinement and reduction of the time step can lead to a dramatic increase in the overall computational cost for such problems, which may become unacceptable in some cases.
The calculated and actual values of piercing torques and power at the steady-state phase of defor- mation were also compared. A relative difference between values obtained in the piercing mill and the computer model (for two sizes of the shells) are: for the torque — 15–20 %, for the piercing power — 5–7 %. Calculated values of these parameters are higher than for the experimental ones. Comparison of rolling forces was not possible because the stand of TPA 70-270 is not equipped with measuring cells.
The differences between predicted and measured values of these parameters are most likely a result of inaccurate representation of the properties of the workpiece, including its temperature, friction coefficient values and by the law of friction, utilized for the simu- lation. It must also be taken into account that the rolling torque at the mill is estimated through the main drive current. This contrib- utes a significant error in evalu- ation of the rolling torque on the rolls.
Fig. 6. The shape of the front and rear end of the hollow shell during the QForm simulation
ITAtube Journal No1/February 2019
26
