
Page 12 - ITAtube Journal 1 2019
P. 12
12
Market information
represents a mere 1% of the total tube and pipe market. Some regions, however, still show signif- icant building activities. (Fig.9)
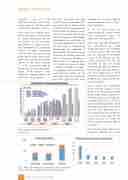
China leads the building activi- ties for coal plants - 599 shelved, 256 under construction and 211 announced - as well as nuclear power plants - 20 under construc- tion. India reports 132 coal plants shelved, 69 under construction and 93 announced, and 5 nuclear power plants under construction. Indonesia as third in the ranking reports 45 coal plants shelved, 39 under construction and 88 announced, but no nuclear power plants. These countries create significant regional demand for boiler tubes of all qualities.
All these steel tube and pipe markets can be subdivided into a commodity volume and a section with more high-tech requirements. For the latter, the decisive factors are the steel quality and the tube plant infrastructure. Steel quality requirements for many high-tech steel tube applications is exact- ing with regard to chemistry and homogeneity. The availability of steel qualities with the necessary uniformity for welded tubes and pipes - as steel strip and plates as well as billets for seamless tubes - is limited and creates at times a significant hurdle for produc- ers supplying tubes and pipes for such high-tech markets. On the other hand, tube plant infrastruc- ture with regard to tube mills,
finishing lines as well as applied quality assurance is also of signif- icant importance.
It can be shown that the above-mentioned market trends have considerable impact on global steel tube production.
Steel tube and pipe production was characterized by steady growth until 2015 when it topped a volume of more than 171 000 tons p.a. (Fig.10) The downturn in 2016 to 167 000 tons p.a. was mainly reflected in the USA, CIS and ROW. In 2017 the market turned around again but China as the main tube and pipe producer lost about 6000 tons p.a. while all other countries increased their production to compensate for the Chinese shortfall.
Fig.11 shows the breakdown for the relevant regions in more detail. The US in particular, helped by the trade policy offensive of President Trump, grew production by about 3000 tons p.a. (+34%). In Q3 2018 (extrapolated), world steel tube production was on the up once more, dominated by a fast-recovering China (+2500 tons p.a. or +3%) and, again, the US (+1350 tons p.a. or +13%). All other countries evidenced little or no growth.
From January 2018, pipe prices increased, reflected in a hike
Fig.8: Evolution of structural systems Source: Irjet
Fig.9: Major coal and nuclear power plants under construction Source: CoalSwarm, Global Coal Plant Tracker and IAEA
ITAtube Journal No1/February 2019
