
Page 43 - ITA Journal 3-2018
P. 43
out while really present. In the worst case, the speci cations might even be violated without being signaled by the measuring device.
The following example of a temperature pro le taken over a week in September 2000 shows to which extent averaging of a measuring value can in uence the perception ( gure 2).
The displayed “real value” results from single measurements taken in ten minute intervals. Averaging over a period of one hour only smoothes the extreme values. When averaging the varying temperature for more than 12 hours, the changes in temperature are displayed lower than they actually are. Furthermore, if the mean value is generated over an entire day, the information about the daily temperature variations will be completely lost. A device that needs the latter averaging depth will not be suitable for a process where an alarm has to be raised or an adjustment has to be made depending on the temperature range.
A practical example taken from the hose and tube production process is the diameter measurement based on the shadow projection method with rotating mirrors. Often high measuring rates are indicated, which result from the rotation rate multiplied by the number of mirrors’ facets ([1] Zanoni, 1973; [2] Vossberg, 1981). The speci cation of accuracy, however, is usually based on mean values of up to one second due to a relatively poor single value precision. This has various reasons. Each single measurement is done with a different mirror facet. Product move- ments during measurement increase or decrease the product diameter – depending on the direction of movement – as the measurement of both product edges is not done simultaneously but sequentially. Lastly, the diameter information is only derived from the very transition from dark to light and light to dark. The rest of the time, the information content of the measurement signal is zero.
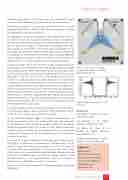
In contrast to this, for other measuring techniques such as the diffrac- tion method ([3] Blohm, Sikora, & Beining, 2005; [4] Blohm & Sikora, 2017), line scan cameras are used ( gures 3 and 4).
On the one hand, product edges are recorded simultaneously – so product movement is not an issue. On the other hand, each single pixel in the diffraction seam outside the product shadow can be directly linked to the product edges. This leads to a much higher single value precision and consequently, the measuring value has to be averaged nowhere near as long to be used for controlling or characterization of a production process.
In conclusion: A mere comparison of measuring rates without consid- ering these circumstances is obviously not suf cient. Hence, for an objective comparison of two measuring devices, at rst, it is important to clearly de ne the requirements of the process. Also, the catalog details given by the manufacturer should be taken into question and brought to a comparable basis using the information needed, so that the investment in a new measuring device leads to an increase in quality, process optimization as well as cost savings.
Author: Dr. Hilmar Bolte, Research & Development/Head of Analysis SIKORA AG
Figure 3: Line sensor technology for diffraction analysis in a SIKORA diameter gauge head
Technical Papers
Figure 4: Diffraction signal on a CCD line sensor
References:
[1] Zanoni, C. (1973). Patentnr. US3856412A. USA.
[2] Vossberg, C. A. (1981). Patentnr. US4269514A. USA.
[3] Blohm, W., Sikora, H., & Beining, A. (2005). Patentnr. US6922254B2. USA.
[4] Blohm, W., & Sikora, H. (2017). Patentnr. US9797712B2. USA.
SIKORA AG
Bruchweide 2
28307 Bremen/Germany
Phone: +49 421 48900-0 Fax: +49 421 48900-90
sales@sikora.net www.sikora.net
ITAtube Journal No3/October 2018
43
