
Page 12 - ITA Journal 3-2018
P. 12
12
Market information
a hike in output levels by non- OPEC producers of as much as 2.2 million barrels / day. But at the same time, the US sanctions on Iran and Venezuela may reduce pumping output levels by up to about 2.1 barrels/day.
If the IEA and Citigroup are correct in their assumptions, the world could be faced with an oversupply of oil – unless the US sanctions remain effective. Currently it is evident that the market believes that they will; as a result, oil
prices climbed to 85 US$ / barrel in October 2018 – bringing it for- cibly home to analysts that oil price forecasts may be overturned by political intervention.
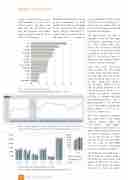
The upward trend has had an immediate effect on OCTG pipe consumption, particularly in the US. Since January 2018, pipe prices have increased, re ected in a hike on the pipe price index of about 25 %, from 200 to 250 (Fig. 9). The positive signals in 2018 have also prompted traders to begin cautious restocking.
These pipe price corrections have certainly left their mark on the world steel pipe produc- tion (Fig. 10). 2016 was consid- ered a no-growth year (-2.5 %). In 2017, global tube produc- tion increased slightly (+1 %) and the upward trend has so far been maintained in 2018 (+2 %). Looking at regional statistics for 2018, it is notable that only Other/ROW experienced a fall in pipe production (-5 %). All other regions increased their production gures (China +2 %, US +13 %, CIS +5 %, India +2 %).
The most signi cant variations were again seen in the market segment seamless pipes and tubes (Fig.11). Global produc- tion volumes increased by 1% in 2018, dominated by China with its massive production volumes (+2 %), the US (+15 %), India (+18 %), CIS (+18 %) and Japan (+6 %). Only in Other/ROW (-33 %) was there a signi cant reduction in production volumes.
The production of welded pipes < 406 mm OD saw a global produc- tion volume increase in the second quarter of 2018 (+4 %). China, after a weak 2017, was among those able to report an upturn
Fig. 8: Cost to produce a barrel of oil
Source: UCube by Rystad Energy, published October 2, 2018
Fig. 9: Producer pipe price index as per August 11, 2017 (Jan. 1982 = 100 %) Source: US Bureau of Labor Statistics/ Federal Reserve Bank of St. Louis
Fig.10: World steel pipe production in Ttons
Source: ITAtube Journal/Wirtschaftsvereinigung Stahlrohre e.V.
ITAtube Journal No3/October 2018
