
Page 11 - ITAtube Journal 2/2019
P. 11
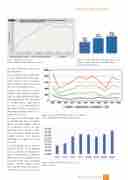
Figure 6: Producer Price Index
Source: FRED US Bureau of Labor Statistics
Figure 7: US Tube and Pipe Production 2016 – 2018 (ktons) - Source: ITATube Journal/Wirtschafts- vereinigung Stahlrohre e.V.
on such challenges imposed on tube producers.
The second important market with a market share of 15% is the auto- motive market. Tubes and pipes with a diameter up to 90 mm are the main consideration here.
Despite some weakness in 2018 and 2019, this market is character- ized by relative stability and high demand growth of 2%. (Fig.9) Due to weight-saving requirements for cars, it can realistically be expected that tubes may even see their implementation share in car production increase.
The present trend towards elec- tro-mobility may have a negative impact on pipe supplies utilized for combustion engines. As yet, alternative drive systems repre- sent a minor percentage of new- bought vehicles, but ongoing developments should be closely observed.
As demonstrated here in the last (2019/1) edition of the ITAtube Journal, regional sales  gures are quite inhomogeneous. Countries like Russia (+15%), Brazil (+13%) and India (+7%) show continued growth, whereas Japan offsets these growth trends and shows a decline in car sales of 11%. The
Figure 8: Tube and Pipe Imports into the US (ktons) Source: Wirtschaftsvereinigung Stahlrohre e.V.
Figure 9: World Car Production (1000 units) Source: Statista
Market information
ITAtube Journal No2/May 2019
11
