
Page 6 - ITAtube Journal 1 2019
P. 6
Market information
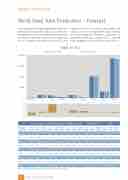
World Steel Tube Production – Forecast
In the first 3 quarters of 2018 the World Steel Tube Pro- duction reaches 129.8 million tons, an increase of 1.5 %. The production of seamless tubes increased 1.9 % to 32.6 Mio to, significant is the increase in India with 31.6 %. Germany reached with an increase of 8.5 %
a positive result in the seamless tubes market, but a minus of 17.1 % in large diameter tubes. Chinese steel tube producers achieved a production of 70.8 million metric tons, a minus of 0.2 %, the USA with a production of 8.8 million tons a plus of 15 %.
140.000
105.000
70.000
35.000
0
16 12 8 4 0 -4 -8
Germany
EU USA
Japan
GUS
India
China
Other
World
III. Quarter 2018
III. Quarter 2017
Total in Tto.
seamless tubes
Region/ 3.Q 3.Q Change 3.Q 3.Q Change 3.Q 3.Q Change 3.Q 3.Q Change 3.Q 3.Q Change
2,920 3.6 6,374 1,513 19.4 6,137 971 5.5 2,534 3,380 6.1 4,516 375 285 31.6 1,200
6,277 1.5 1,228 1,229 -0.1 7,602 5,435 12.9 955 790 20.9 7,092
2,525 0.4 1,009 4,648 -2.8 2,177 1,200 0.0 1,500
3,025 1,807 1,024 3,585
1,059 -4.7 3,543
1,847 17.9 6,693
1,500 0.0 2,700
7,050 -14.9 50,250 50,000 0.5 70,875 71,000 -0.2 3,514 -1.1 19,285 19,383 -0.5 21,518 21,369 0.7
welded tubes <406
welded tubes >406
welded tubes
country 2018 2017 in % 2018 2017 in % 2018 2017 in % 2018 Germany 965 889 8.5 669 698 -4.2 748 902 -17.1 1,417
EU
USA
Japan
GUS
India
China
Other
World
Wirtschaftsvereinigung Stahlrohre e.V.figures include estimations
20,625 21,000 -1.8 44,250 42,950 3.0 6,000 2.233 1.986 12.4 15,810 15,869 -0.4 3,475
32,674 32,055 1.9 80,821 78,904 2.4 16,344 16,989 -3.8 97,165 95,893 1.3 129,839 127,948 1.5
6 ITAtube Journal No1/February 2019
TOTAL
2017 in % 2018 2017 in %
1,600 -11.4 2,382 2,489 -4.3 7,506 1.3 10,627 10,426 1.9 6,225 13.9 8,899 7,738 15.0 3,584 -1.1 4,567 4,555 0.3 6,495 3.0 10,278 9,875 4.1 2,700 0.0 3,075 2,985 3.0
